Competency 3.2: Perform social network analysis and
visualize analysis results in Gephi.
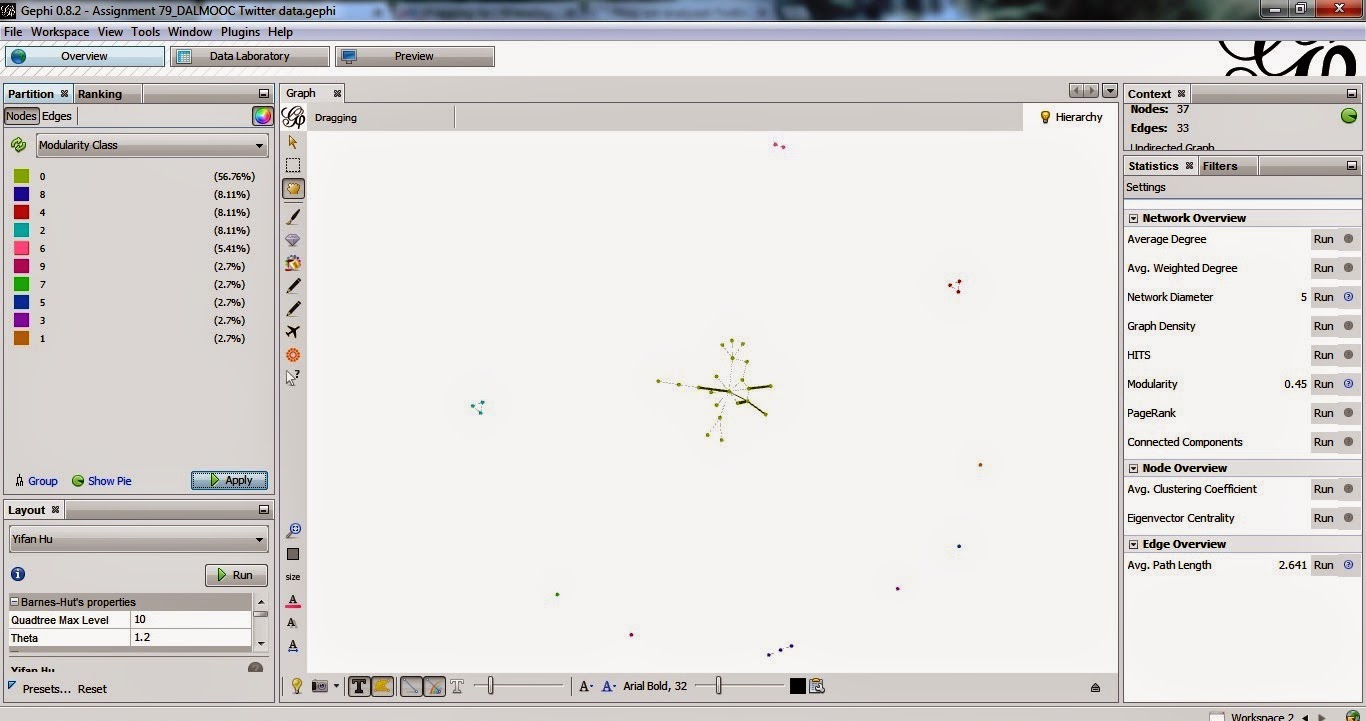
I did assignment 79 in which we are asked to extract data from twitter and analyse the twitter network in Gephi. I extracted twitter data using NodeXL, a freely available add-on to excel. I searched for all tweets with the tag DALMOOC and used it as my data set.
I exported the data from NodeXL as a Graphml file which I then used to import into Gephi. I tried different visualizations and measures. I was pretty amazed to see what difference a good visualization can make in analyzing and presenting data :) The snapshots should be quite self-explanatory.
It was interesting to see the network graph color-coded by the geographical location (This is only a part of the whole network graph).

I've varied the degree of centrality by color (This is only a part of the whole network graph)

The graph density was 0.050 and the diameter of the graph was 5.


The modularity report is shown. There were 13 communities, some having single and two peers.

I applied the giant component algorithm to filter out small communities.Now five main communities that emerged are color coded and shown below:

It was very interesting to apply different visualization techniques to our course data. Hoping to use these types of visualizations on my own research data!

No comments:
Post a Comment