Tuesday, December 16, 2014

Competency 4.1


Competency 4.1: Describe and critically reflect on approaches to the use of social network analysis for the study of learning.


I've seen some great insights on how to use social network analysis to improve learning. The impact of social network analysis on educational constructs like learning design, sense of community, creative potential, social presence, academic performance and MOOC pedagogy looks promising. The possible data sources could be discussion boards, course enrollments, twitter and other social networks data, self-reports or course design. Metrics like network density, degree centrality, eccentricity, modularity etc. help us to get an idea about the network of and individuals in a network.

Learning design could affect students’ activities in a big way. Students who are familiar with a design are generally more comfortable using it. To see if students in a course are learning as expected, we can monitor them using SNA and guide them as needed. We can see at what stage the instructor's role is more important than peer-facilitation by seeing the interactions and provide help to students.

Monitoring the sense of community will be useful in identifying isolated groups/ individuals who may not receive all information. We can in such cases guide them to be part of larger communities. We can also advise students to join new groups for assignments to get connected to more students. These factors can impact the creative potential, social presence and academic performance of students if suitable help is provided. Awareness of more ways of communication and their usefulness should be advocated to students to help them understand the distributed structure of MOOCs and be better involved.

I would think that this kind of analysis should happen along the way in any course to see how students are doing in the course of time. Seeing the results at the end may not be of much help to students. Rather, positive measures can be taken like introducing new hashtags for better connection or introducing a list or shared document of all students and their resources will help students better in the rest of their course. It could be beneficial to connect different social networks to get the complete picture about an individual student as well.

Monday, December 15, 2014

Competency 3.2/ Assignment 79

Competency 3.2: Perform social network analysis and visualize analysis results in Gephi.

I did assignment 79 in which we are asked to extract data from twitter and analyse the twitter network in Gephi. I extracted twitter data using NodeXL, a freely available add-on to excel. I searched for all tweets with the tag DALMOOC and used it as my data set. 

I exported the data from NodeXL as a Graphml file which I then used to import into Gephi. I tried different visualizations and measures. I was pretty amazed to see what difference a good visualization can make in analyzing and presenting data :) The snapshots should be quite self-explanatory.

It was interesting to see the network graph color-coded by the geographical location (This is only a part of the whole network graph).


I've varied the degree of centrality by color (This is only a part of the whole network graph)


The graph density was 0.050 and the diameter of the graph was 5. 


The modularity report is shown. There were 13 communities, some having single and two peers.


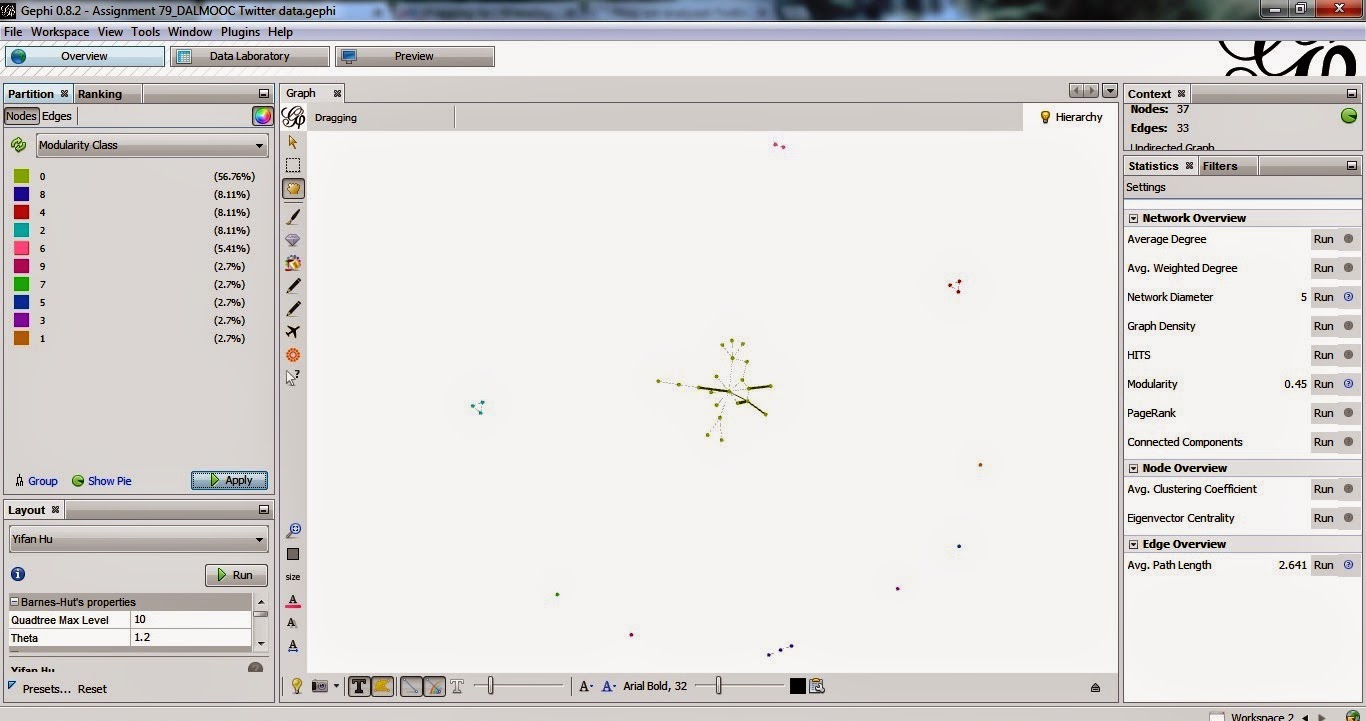
I applied the giant component algorithm to filter out small communities.Now five main communities that emerged are color coded and shown below:


It was very interesting to apply different visualization techniques to our course data. Hoping to use these types of visualizations on my own research data!

Competency 3.1 - Basics of Social Network Analysis

I'm going back to Weeks 3 and 4 to learn about Social Network Analysis since the course is nearing completion. I will go back to the final wrap up Week 9 after I finish these two weeks' lessons.

Competency 3.1: Define social network analysis and its main analysis methods.

Social Network Analysis (SNA) provides insights into how different social processes unfold while learning happens in any learning environment. It helps us to study the effects of interaction and social context in education. The different network elements are actors and their relations. 

The nodes/ actors could be students email addresses, tweets or any such actions. I would typically use SNA to see the interaction between students, for example in a chatroom/ discussion forum, to see who is talking to whom, who replies to whom, who is following what question, who voted for a question etc. Based on the interaction patterns, we can construct the network graph. We can from here see if any measure from the network can correlate to learning or performance.  

Some measures in SNA for analysis are below:

Diameter:

Diameter determines the longest distance between any pair of nodes in a network. It measures the extent to which each individual node can communicate with any other node in the network. 

Density:

Density determines the potential of the entire network to talk to each other. It can be used to determine the extent to which some individual nodes share the information. The spread of information is very fast in a highly dense network. 

Degree Centrality:

Degree centrality is a simple measure that indicates the overall number of connections for each actor in a network. Network measures may have specific meaning when considered in the context of directed graphs.
In-Degree Centrality:
In-degree centrality is a measure of the number of other nodes that directly try to establish connection to a particular node. Also refers to the popularity or prestige of a node in a network.
Out-Degree Centrality:
Out-degree centrality is the measure of the number of nodes to which particular nodes are talking. 

Betweenness Centrality:

Betweenness centrality indicates the ease of connection with anybody else in the network, in particular, to try to connect all small sub communities in the network. Brokerage role is best measured by this measure.

Closeness Centrality:

Closeness centrality measures the ease or the shortest distance of a node to anybody else in the network. It indicates how quickly a node can get to another node in the network.

Network Modularity:

Network modularity is used to identify common sub-groups talking to each other where a group of actors have close ties to each other. An algorithm for finding the giant component can be used to identify the largest component of all connected nodes in the network. This filters out single nodes that are not connected to the network to easily identify and analyse communities in the network.


Friday, December 12, 2014

Competency 8.5

Competency 8.5: Examine texts from different categories and notice characteristics they might want to include in feature space for models and then use this reasoning to start to make tentative decisions about what kinds of features to include in their models.

I tried the Bazaar activity in Prosolo (but my myself since I didn't get matched to a teammate), to explore advanced feature extraction in LightSIDE and see which features work well giving better performance. I first used the sentiment_sentences data set and configured stretchy patterns using the pre-defined categories positive and negative. There was a very significant improvement in performance from unigrams only to stretchy patterns.


To look at the details, I used Explore results pane to analyse the results.


The more indicative words which occurred more times had stronger weights (E.g. dull, too, enjoyable). Commonly occurring words like a, of and punctuation had lesser or no feature weights assigned to them. The stretchy patterns helped in predicting many positive and negative instances correctly, by considering the position and structure of previous and coming words. Examples below:
STRONG-POS [GAP] , but --> the movie is loaded with good intentions , but ---> neg
one [GAP] the STRONG-POS --> one of the best of the year --> pos


In the newsgroup data set, there were overlaps in some categories like religion & atheism, forsale & windows due to some words. The context should be captured more in such cases using stretchy patterns.

In my test data set of plants classification into fruits, vegetables and flowers, it was seen the the unigram features were most predictive. The structure of the text was not of importance since the unigrams feature space did a decent prediction than bigrams and trigrams included.


Thursday, December 11, 2014

Competency 8.3/ 8.4

Competency 8.3: Compare the performance of different models.

I compared two models, one from a unigram only feature set and the other from a unigram, bigram and trigram feature set using my test data set. I was at first using the Newsgroup data set as suggested in the Prosolo assignment, but some options were not working for me in the Explore results tab of LightSIDE. I was not sure if I could make a proper analysis without Feature weights, so I chose to use my small test data set instead. Below is the comparison of the two models:


Competency 8.4: Inspect models and interpret the weights assigned to different features as well as to reason about what these weights signify and whether they make sense.

I went to the Explore results tab to do some basic error analysis. The confusion matrix of 123 grams model was better than the 1 grams model. I looked at specific features in detail that predicted wrong categories.


E.g. The term "flowering" which had a high Feature Influence for flowers wrongly predicted a fruit which contained the term as a flower. Few terms like "genus", "plants" did not make a correct prediction even along with its bigram and trigrams:


The data set was very small, so it did not have enough features to train the model on. There were many wrong predictions in the case of punctuation features as well. I guess that the model would do well when trained with more data using unigrams, bigrams and trigrams.


Wednesday, December 10, 2014

Competency 8.2

Competency 8.2: Build and evaluate models using alternative feature spaces.

I used the different feature spaces that I saved in the previous exercise for building models. My data set was very small and I intended to use it just for testing. I found significant improvement in metrics while comparing the models of POS features Vs Unigrams and bigrams. I could see from my data that the n-grams were most predictive of the categories.


I couldn't find significant improvements in model metrics for many basic features. I used Naive Bayes as the classification algorithm. I also tried other algorithms, but there was not a big difference in the metrics' values. Few feature spaces I tried along with the metrics for their models are below:
                             
Feature Space
Accuracy
Kappa
POS grams
42%
0.12
12 grams_count
58%
0.36
1 grams_pairs
61%
0.41
12 grams_length
61%
0.41
12 POS grams
65%
0.47
12 grams_no stop
69%
0.52
12 grams
73%
0.59
123 grams
73%
0.59

To test with a real data set, I tried the hands on activity of text feature extraction given in Prosolo using sentiment_sentences data set. I extracted different feature spaces from the basic feature set and used logistic regression. There was significant improvement while expanding the feature set.


Competency 8.1

Competency 8.1: Prepare data for use in LightSIDE and use LightSIDE to extract a wide range of feature types.

For the purpose of this exercise, I created a simple data set of three types of plants: vegetables, fruits and flowers. I classified text (taken from Wikipedia) based on the three categories. It looked like this:


I loaded my input csv file into LightSIDE and extracted basic features like unigrams and bigrams first. Then I checked different basic features and extracted their feature sets.


I saved all the feature sets for building models later using alternative feature spaces. 


All materials are based on the EdX course - Data, Analytics and Learning
Creative Commons License
This work is licensed under a Creative Commons Attribution 4.0 International License.